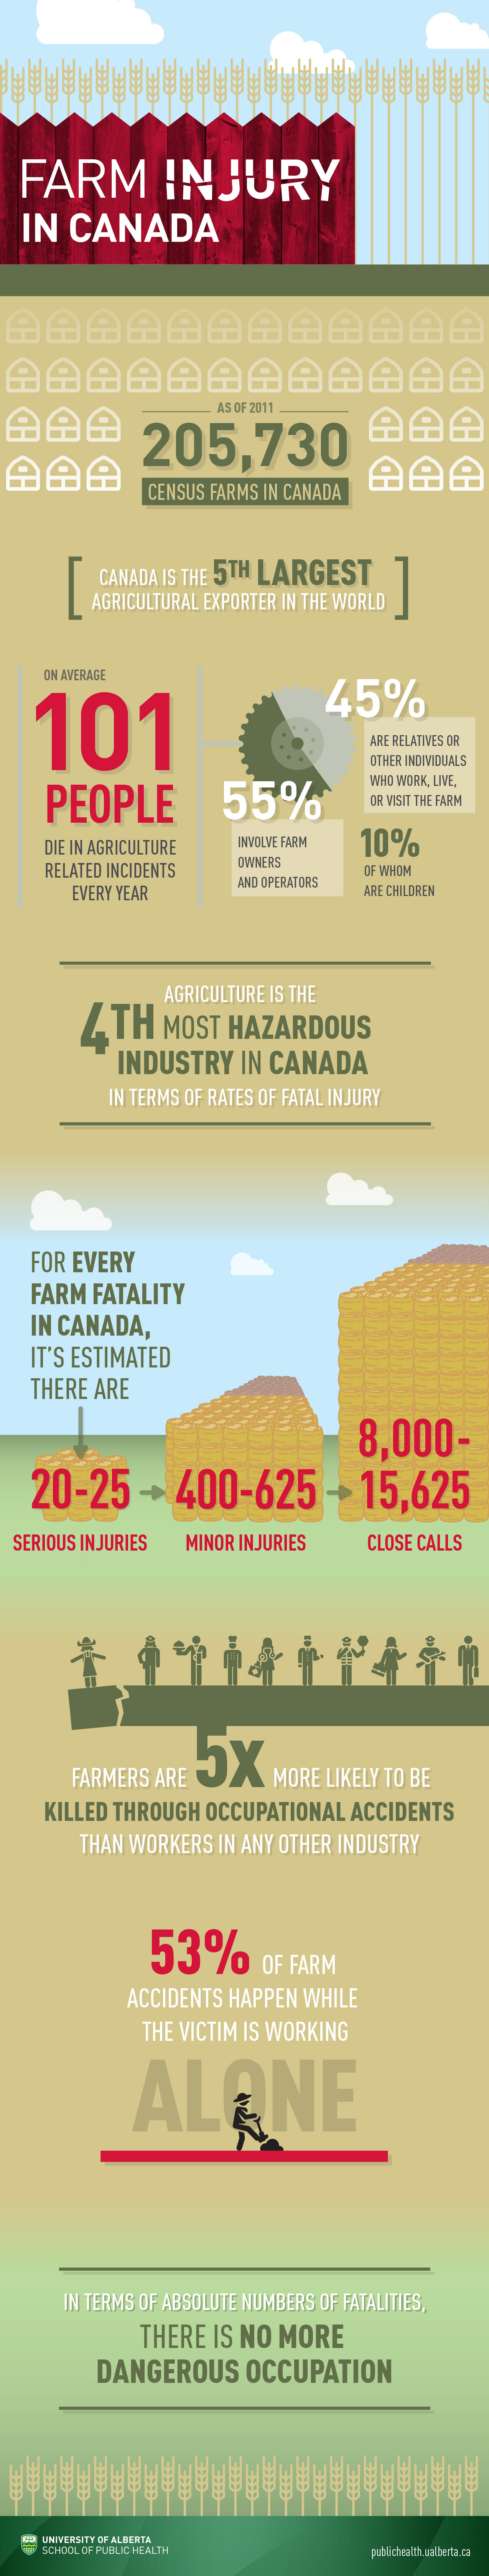
These scrolling infographics are intended to be viewed progressively from top-to-bottom, not all at once. The first, created for the University of Alberta's School of Public Health, is intended to lay out important farming statistics in an interesting way. The second, created for Stantec, showcases the company's acquisition of the SHW group, providing statistics which justify the decision.